Quantitative Risk Management with FAIR — Evaluate Loss Event Frequency
Quantitative Risk Management with FAIR — Evaluate Loss Event Frequency
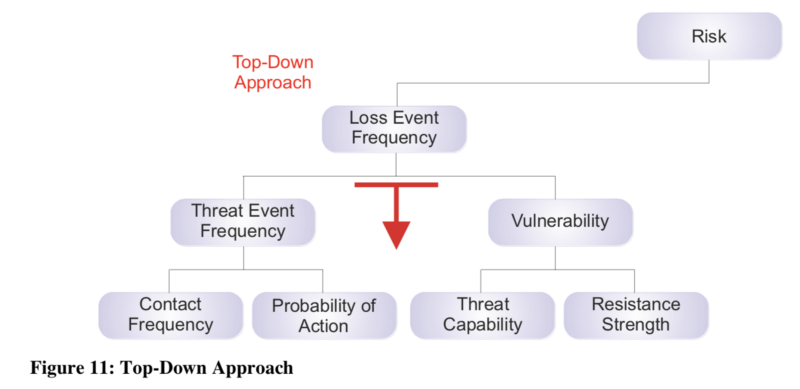
In FAIR, Loss Event Frequency refers to what is typically called “Likelihood” in qualitative approaches to Risk Management. Here we’ll be doing some of Stage 2
It’s defined as the probable frequency, in a given timeframe, that the threat agent or community we’re assessing ourselves against will inflict harm or damage upon the asset we’re risk assessing. In our scenario, it means what we believe is the probably frequency within the next year, that an individual cybercriminal or organised group would attempt a Ransomware attack against our organisation.
Estimating Threat Event Frequency
According to Verizon’s Data Breach Investigations Report 2019, only 28% of overall security incidents were related with Malware, and of those circa 25% relate to Ransomware with the vast majority (circa 45%) being C2 (Command and Control) incidents.
However, over 50% of overall breaches are now happening due to organised crime which has been on the rise from previous years.
Another relevant source of information are Insurance providers, as they will typically deal with claims from their customers, even the ones not forthcoming to the press about these types of events which, as they won’t necessarily be breaches, they may not be reported.
Beazley recently published a report, which is consistent with information released by the FBI and CNN, that in 2019 its customers saw an increase in 105% in number of ransomware attacks compared to same period last year, and also a 95% in ransom demanded (from $116.324 to $224.871).
The ENISA Threat Landscape reports something slightly different though.

It mentions a significant decrease (from 7th to 14th in the list) whilst still acknowledging it’s a relevant threat that shouldn’t be ignored.
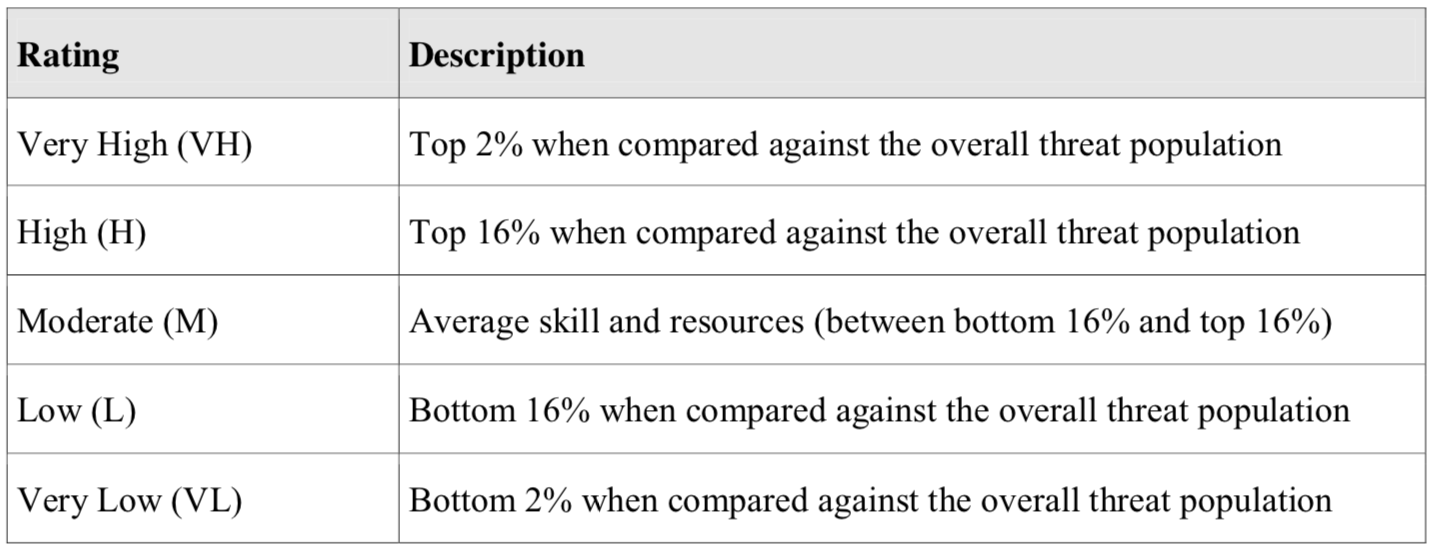
Referring back to the Threat Event Frequency Ratings list, I would assert it to most likely be a Low (L) Rating, happening between once a year to once every 10 years, particularly for a small retailer such as Juice Shop. The minimum value would be a ‘Very Low’ and I would deem it unlikely for an organisation to be hit more than once a year with a Ransomware attack, though it is in the realm of possibility. As will be seen further down, Social Engineering and Phishing training helps drive this number.

In this scenario, and as the threat materialises through user-initiated actions and clicking on web links is something performed by the Customer Service teams hundreds of times per day, estimating Contact Frequency for this particular scenario would be difficult.
Estimating Threat Capability
In order to derive vulnerability, we need to first understand the Threat Capability. Threat Capability (or TCap) refers to the probable level of force that the threat agent is capable of applying against an asset. In our scenario, this means the probable sophistication of the cyber criminals or organised group in launching Ransomware attacks.
The ENISA threat Report is somewhat alarming regarding the level of sophistication that is now required from these threat agents in order to carry out a Ransomware attack:
“Their analysis counted more than 3 million registered Dark Web users in 25 sites that are offering access to tools and information for attacks. The content shared was considered sufficient for any wannabe attacker, regardless the technical knowledge or experience. Noteworthy that, 12% of the available Dark Web material was ransomware-related. Moreover, the cost for accessing the material is extremely low. This environment allows anyone with just a small amount of money to be able to conduct attacks using already developed tools and methods”
If we look at Threat Capability Ratings list and given this information, I would assert a minimum value of ‘Very Low’ and a maximum value in ‘Moderate’ as Juice Shop is a small retailer compared to other targets, with most likely being ‘Low’.
Estimating Resistance Strength
Resistance Strength, sometimes called Control Strength too, relates to the strength of the controls compared to a baseline of force. In our scenario, it relates to how strong and assured are our controls against a Ransomware attack which manifests itself via user-initiated actions.
In this section, it’s relevant to mention that Resistance Strength doesn’t only relate to the strength and breadth of technical controls that could prevent the threat from materialising but also on the other factors that can diminish the impact of losses relating to the this threat event (this will be further explored in the next blog post).
So in order to assess overall resistance strength, I would refer to the guidance provided by the Center For Internet Security (CIS), which refers to a number of countermeasures for organisations to protect themselves.

As can be seen from the previous, there are some controls in place and a significant room for improvement. Based on the information on the table above, and the Resistance Strength Ratings below, I would assert the minimum value to be ‘Low’ and maximum of ‘Moderate’.

The controls expressed above were put together for the sake of assessment, however be aware that ‘Social Engineering and Phishing training’ is more related to ‘Contact Frequency’ or “how many times the threat agent comes into contact with the asset”, and ‘Backups’ and ‘Incident Response plan’ will be more relevant when asserting Loss Magnitude and how big the related losses could become in terms of Productivity and Response related losses (more on this in the next blog post).
Deriving Vulnerability
As can be seen from the beginning of the blog post, in order to derive Vulnerability we need to first establish first the Threat Capability and the Resistance Strength, which we’ve done. In order to do that, we ca refer to another table.

In our scenario, with a most likely Threat Capability of ‘Low’ and a Resistance Strength of ‘Low’ to ‘Moderate’, the Vulnerability will be either ‘Low’ or ‘Moderate’.
Deriving Loss Event Frequency and summary for the calculations
Finally, we’ll be ready to derive the Loss Event Frequency based on what we’ve done so far. Referring to the Loss Event Frequency Ratings:

We had asserted that ‘Threat Event Frequency’ would most likely be a ‘Low’ and ‘Vulnerability’ as ‘Low’ or ‘Moderate’, would make the ‘Loss Event Frequency’ as ‘Very Low’ or ‘Low’.
In FAIR, as we assert for each element of the assessment a Minimum, Most Likely and Maximum value, we still have our Monte Carlo simulations to perform to provide further confidence in the results. So, let’s summarise the values that would go into those computations from the risk analysis which was performed here.

In order to perform the calculations, I’ve used OpenFAIR’s Risk Analysis Tool which is in Beta and accessible from https://publications.opengroup.org/i181 for 90 days free licence. I recently became aware of other open tools like tidyrisk.org and https://github.com/theonaunheim/pyfair but am yet to try them. Maybe some future blog posts.
So, to wrap up the Loss Event Frequency post, and having a measure of how often this risk is likely to materialise we end up with the following view:

This suggests there’s a high chance of the risk not materialising, circa 78% and circa 20% chance of happening once on a year.
Final Notes
Really enjoyed doing this exercise, and the way the formulas are broken down really focused me, as the risk analyst, to validate and look for data sources to answer each of the individual questions with a documented basis. Definitely a number of steps above from what I’ve seen Qualitative Risk assessments done previously which is clear and quick bias onto a 4xx4, without much thought given to it.
In he next blog post, we’ll be doing a similar activity and level of detail into asserting Loss Magnitude for this same scenario.
Hope you’ve enjoyed it and continue following the series
Mario Platt
NEXT IN SERIES → https://medium.com/@marioplatt/quantitative-risk-management-with-fair-evaluate-loss-magnitude-557eb29407b7
References:
Verizon’s Data Breach Investigations Report 2019, https://enterprise.verizon.com/resources/reports/2019-data-breach-investigations-report.pdf
Beazley Breach Insights May 2019, https://www.beazley.com/news/2019/beazley_breach_insights_may_2019.html
ENISA Threat Landscape Report, https://www.enisa.europa.eu/publications/enisa-threat-landscape-report-2018
Invenioit Ransomware Statistics, https://invenioit.com/security/2018-ransomware-statistics/
Center for Internet Security — Facts, Threats and Countermeasures, https://www.cisecurity.org/blog/ransomware-facts-threats-and-countermeasures/