Quantitative Risk Management with FAIR — Evaluate Loss Magnitude
Quantitative Risk Management with FAIR — Evaluate Loss Magnitude
We’ve come very far in the last few blog posts, and have the second part of the Risk equation (the first being Loss Event Frequency which we’ve asserted in the last post) which is the Loss Magnitude in the FAIR Risk Taxonomy.
It’s comprised of the following:
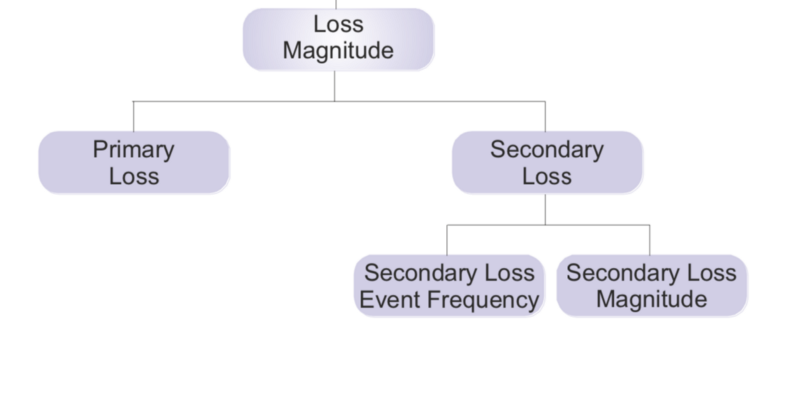
In order to discuss them, let’s define some of the terminology first to ensure we understand what each of them entail, however before thinking about Primary and Secondary losses, I believe it’s appropriate to first start with the 6 forms of losses that the framework considers.
The 6 forms of losses in FAIR and application to our scenario
One form of loss is Productivity. It is somewhat self-explanatory, but it represents the reduction in capacity or capability to perform the value proposition whether that is providing good, services or any other form of income. Here you would also consider the the incurred costs with staff, that you’re still liable for, even if the systems they use to perform the service are unavailable or significantly impaired. In our scenario, this would be the sales loss for Contact Centre staff not being able to take orders whilst their desktop isn’t available as well as the staff costs themselves.
Another form of loss is Response. Here you would consider all expenses incurred in managing and responding to the loss event. There’s a lot to it in a Ransomware scenario, which our scenario would include over-time from IT and Security teams handling the response, external support from a Forensics team helping manage the incident as you’d typically want the support of professionals used to dealing with these situations, costs with Public Relations and any insurance premium if you’re covered by cyber insurance which includes clauses for Ransomware.
Then we have Replacement losses. Those come about relating to the capital expense which is associated with replacing lost or damaged assets. In this scenario, I don’t believe we’d have associated replacement costs as worst case scenario would be to improve the control environment protecting the assets.
Another typically major loss concern for organisations is Fines and Judgements. This relates to legal or regulatory actions that may be brought to an organisation. Think GDPR (or other regulatory fines) or customers in B2B bringing your organisation to court over breach of contractual terms. Legal defence costs are covered under Response though. In this scenario, as the risk is to complete and unavailability of data but doesn’t pose a risk to rights and freedoms of the customers, and Juice Shop doesn’t provide services to B2B, we will not be considering any Fines and Judgements costs.
Competitive advantage is another type of loss. This would include items associated with loss of a competitive position. This could include trade secrets, mergers and acquisitions plans being made public etc. In this scenario, we won’t be considering any competitive advantage losses.
And, finally, Reputation losses. These are associated with an external stakeholders, which can include customers and shareholders for instance, perception that the value proposition has been diminished or that doing work with Juice Shop could represent a liability to them. This could mean market share loss, reduced stock price for companies which are publicly traded or even increased cost of capital. In our scenario, we will consider an impact relating to loss of market share, as selling Juice products is a very competitive market which the customers
What becomes clear after discussing these loss forms, is that our initial map doesn’t provide sufficient details to analyse this scenario, so let’s expand it.
For reference, this how our mapped scenario looked like, and we’ll now drill down to the ‘Corporate data’ aspect of as that’s how we defined the asset we’re risk assessing.

Initial map
Here’s our revised map of the scenario, removing much of the components in order to focus on the asset at risk.
Our “happy path” scenario assumes only one Desktop is infected, so it looks like this, with the main blast radius being the collaboration drives:

Single User desktop infection
Our “less happy path” assumes the initial infection spreads to the other Desktops in the same network segment, and it looks like this:
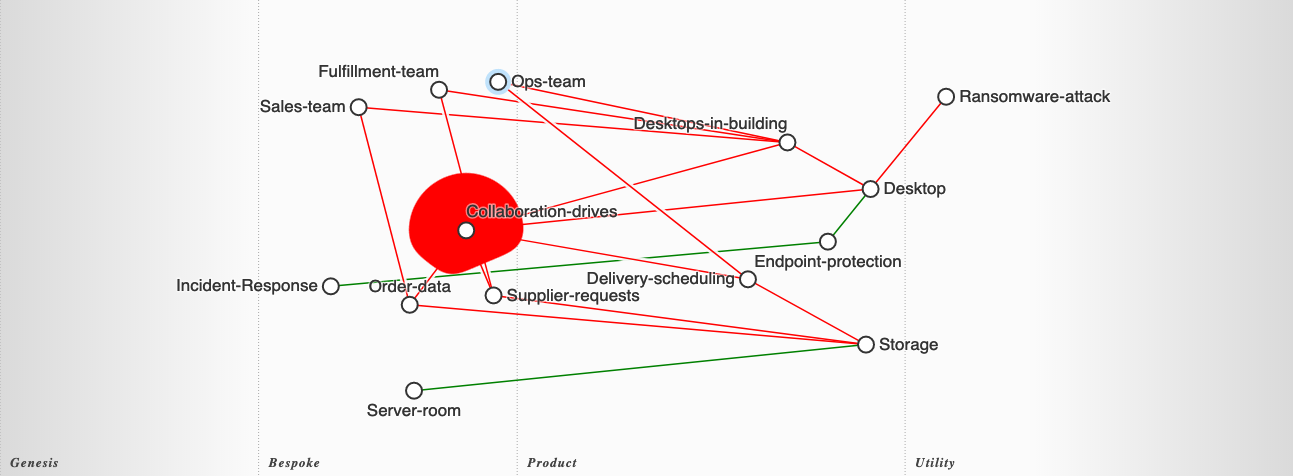
The main threat action we’re concerned with in this scenario is about the denial of access (destruction) of the multiple teams identified to the data they require to perform their jobs.
In FAIR, we need to distinguish between both Primary and Secondary losses.
Primary losses are a direct result of the threat agent actions upon the asset under assessment. In this scenario, that would refer to the Productivity loss resulting from the 3 different teams not having access to the data they require, and the Response cost
Secondary losses relate to the consequences expected to happen (ie reactions) when other stakeholders become aware of the primary loss. If thinking in terms of Threats or Threat Taxonomy, these become threats in and of themselves (I’ll write about adoption of Threat Taxonomies in the future). In this scenario, we’ll consider only Reputation losses.
As with the previous examples, in order to hopefully improve the accuracy and quantitative nature of our risk assessment, we’ll again use Minimum, Most Likely and Maximum values for each.
To assert Productivity losses, I’ll consider 3 different scenarios to align with Minimum, Most likely and Maximum Values. All of these exclude the scenario where a Ransom is actually paid, as that would be an actual number that could then be assessed against the results of this assessment for a business-driven decision. Within the team costs, we include the direct revenue loss from the teams not being productive.
Asserting Primary Loss
Ransomware for minimum scenario calculations
- Only 1 Desktop PC is affected (of the 30 strong people teams), but as they have network drives mounted all the data in Collaboration Drives becomes inaccessible and encrypted
- The 3 teams (Sales, Fulfilment and Ops) keep operating though more “blind” and not able to perform some of their job functions
- Incident Response takes 4h to fully understand the scenario and operational implications. 2 Incident Management resources are dedicated to this, each costing £80/hour
- 2 days worth of Forensics and Emergency Responders are required. 2 resources at a cost of £2000/day each are assigned
- Rebuilding the one Desktop PC that was infected, takes 3h to an IT technician costing £30/hour
- Restoring the available backup to Collaboration Drives takes 7h of an IT technician costing £30/hour
- PR costs will amount to 4 days worth of a PR specialist, costing £450 daily
- 4h initial incident response + 7h of backup restore + 4h of initial incident response means that all 3 teams will operate at 70% capacity over that period of time. We know the team costs are £8000/hour, so that means a cost direct productivity cost of £2400/hour for 15 hours, totalling £36.000
Ransomware for most likely scenario calculations
We can probably make a good estimate, that if one of the machines is infected and as they share the same operational practices and anti-virus versions, that the rest of Desktop estate would also be affected. The assumptions for this scenario are:
- All 30 Desktop PCs are infected with Ransomware.
- The 3 teams completely lose the ability to be productive whilst recovery is on-going
- Incident response takes 7h to fully understand the scenario and operational implications. 3 Incident Managers are dedicated to this, each costing £80/hour
- 5 days worth of Forensics and Emergency Responders are required. 2 resources at a cost of £2000/daily are assigned
- Rebuilding 30 Desktops takes 3h per Desktop. 3 IT technicians are assigned to the activity. 90h worth of effort divided by 3 technicians, is 30h which divided by 8 working hours is circa 4 days worth of effort, and a cost of 90h x £30 =£2700
- Restoring the available backups to Collaboration drives takes 12h of an IT technician costing £30.
- PR costs will amount fo 6 days worth of a PR specialist, costing £450/day
- 7h of initial incident response + 12h of Backup restore + 4 days (32h) of Desktop restore implies neither of the 3 teams can perform any work whilst recovery is on-going. As the teams cost £8000/hour, this implies a cost of £408.000
Ransomware for worst case scenario calculations
The main difference between this scenario and the previous ones, is that we find that the Ransomware attack took about a month to actually present itself after initial infection. There are strains of Ransomware since 2018 that have been noticed to behave as such (https://www.datto.com/blog/new-strain-of-ransomware-encrypts-backup-data ) as such, when Juice Shop organisation attempts to recover data from the backups, they find they’re also encrypted ad are thus unable to recover data from the backup. This would make it a significantly catastrophic event to the organisation. The assumptions to this scenario are:
- All 30 Desktop PCs are infected with Ransomware.
- The 3 teams completely lose the ability to be productive whilst recovery is on-going
- Incident response takes 7h to fully understand the scenario and operational implications. 3 Incident Managers are dedicated to this, each costing £80/hour
- 5 days worth of Forensics and Emergency Responders are required. 2 resources at a cost of £2000/daily are assigned
- Rebuilding 30 Desktops takes 3h per Desktop. 3 IT technicians are assigned to the activity. 90h worth of effort divided by 3 technicians, is 30h which divided by 8 working hours is circa 4 days worth of effort, and a cost of 90h x £30 =£2700
- Restoring the available backups to Collaboration drives is unsuccessful. An incomplete data set is re-built with the help of external parties and best efforts and a significant amount of data is unrecoverable.
- PR costs will amount fo 20 days worth of a PR specialist, costing £450/day
- 7h of initial incident response + 4 days (32h) of Desktop restore implies neither of the 3 teams can perform any work whilst recovery is on-going. They then recover to a 60% capacity as long term absence of data takes additional operational toll. As the teams cost £8000/hour, this implies a direct impact £312.000. We then have a situation where the teams are only 50% productive (as some capacity is used on rebuilding incomplete dataset) for 22 working days, which results in an additional impact of £704.000
Putting these 3 scenarios into their financial implications, we have the following table:

NOTE: I was using OpenFAIR Risk Analysis Beta spreadsheet initially, but it’s failing to allow changes to the Loss Magnitude calculations in my Office 365 online, local install of Excel on MacOS or Google sheets, so I stopped trying. Instead the results below will be from using TidyRisk.org’s Docker container to perform some calculations.
Similar to the spreadsheet, the risk analyst needs to add the details which I transposed from rationale above plus how many simulations we wish to do (I chose 100.000)

Input data to TidyRisk.org
The results are quite interesting.

Loss distribution for Ransomware attack scenario

Value at risk

Event types from the simulations
Given the level of controls in the environment, which aren’t great and introduce significant response and recovery cost, we’re looking at close to £500k Value-at-Risk. What is particularly interesting is that of all those simulated events, and given the controls in the environment, the risk of experiencing a loss event is almost a coin toss 50/50, and I believe many organisations still have this level of control against such attacks (ie not much more than an AV and basic phishing training). This assessment isn’t currently including Reputation losses either.
Closing thoughts
This approach is much more time-consuming than traditional qualitative risk assessment approaches, but yields great results in the following forms:
- Forces the risk analyst to document all assumptions in terms of impact. This implies it can be challenged and improved upon.
- Has consideration for a range of possible scenarios, and not just what the risk analyst wishes to convey (which is often the worst case scenario)
- Is based on running simulations so further confidence can be had on the final results.
- Helps us determine Value-at-Risk
In the next blog post, I’ll be looking at how to improve some controls and the effect they should have on the Response and Productivity losses, so we can then re-assess what that would mean for the overall risk of this scenario.
Hope you’ve enjoyed it!
Mario Platt
NEXT IN SERIES → https://medium.com/@marioplatt/quantitative-risk-management-with-fair-communicating-risk-bb50a2bf24be